

- Understanding the carbon footprint by energy source is a key step for businesses pursuing sustainability, as the energy sector is a major contributor to global greenhouse gas emissions.
- Life Cycle Assessments (LCAs) are crucial for accurately measuring an energy source's total environmental impact, from raw material extraction to facility decommissioning, considering all greenhouse gases.
- Fossil fuels, including coal, natural gas, and petroleum, have significantly higher lifecycle emissions compared to low-carbon sources such as nuclear power, wind, solar, and hydropower.
- The specific carbon footprint of any energy project is influenced by technology, resource quality, operational practices, and the energy mix used in manufacturing components.
- Effective carbon accounting enables businesses to identify emission hotspots, make informed energy choices, report accurately, and develop credible decarbonization strategies.
Understanding the carbon footprint by energy source is a great step for businesses aiming for sustainability.
The energy sector significantly contributes to global greenhouse gas emissions.
Every energy source, from the electricity powering your buildings to the fuel in your supply chain, carries a distinct lifecycle impact.
We'll examine these differences, comparing power source emissions from fossil fuels like coal, natural gas, and petroleum, to low-carbon options such as nuclear, and renewables including hydropower, solar, wind, geothermal, and biomass.
And what they mean for your business's carbon footprint and overall climate strategy.
What exactly is an energy source's carbon footprint? The lifecycle view
When we talk about the carbon footprint of electricity sources, we're looking beyond just what comes out of a smokestack or exhaust pipe. An accurate measure considers the entire lifecycle, a method known as Life Cycle Assessment (LCA).
Decoding Life Cycle Assessment (LCA)
An LCA evaluates the environmental impacts of a product or system within a given system boundary, such as "cradle-to-grave." For an energy source, this means accounting for all greenhouse gas (GHG) emissions, such as carbon dioxide (CO2), methane (CH4), and nitrous oxide (N2O), across its entire lifespan.
These emissions are typically converted into carbon dioxide equivalents (CO2eq) using their Global Warming Potential (GWP).
The common unit for electricity, you'll see, is
grams of CO2eq per kilowatt-hour (gCO2eq/kWh)
The LCA values in this blog include:
- One-time upstream process: Extracting and processing raw materials (like mining coal or manufacturing solar panels), and constructing the power facility.
- Ongoing combustion/non-combustion: Direct emissions from burning fossil fuels, plus operation and maintenance.
- One-time downstream process: Decommissioning the facility and managing waste, including recycling.
Why LCA is key for comparing energy emissions
Using a Life Cycle Assessment (LCA) approach is essential for a fair comparison of energy emissions. Without it, you might only see a fraction of the picture.
For example, while an electric vehicle has no tailpipe emissions, its carbon footprint from electricity generation depends on how the electricity was produced, and the manufacturing of its lithium battery also has a footprint.
Similarly, renewable energy emissions are not zero when you consider manufacturing and installation. This comprehensive view helps avoid shifting environmental burdens from one stage to another.
A look at North America's energy mix
In North America, the United States, Canada, and Mexico have diverse energy production and consumption profiles. This context shapes the carbon footprint by energy source in the region.
- United States: Relies heavily on petroleum, natural gas, and coal for primary energy. For electricity, natural gas leads, followed by coal, nuclear, and a growing share of renewables.
- Canada: A major energy producer, with significant crude oil and natural gas output. However, its electricity generation is non-emitting, mainly dominated by hydropower and nuclear power.
- Mexico: Fossil fuels, particularly oil and natural gas, form the backbone of its total energy supply and electricity generation.
These distinct profiles mean each country faces different challenges in reducing its power sector emissions and overall energy production emissions.
Carbon footprint by energy source: The fossil fuel story
Fossil fuels have long powered economies, but they come with a significant fossil carbon footprint. Understanding the emissions by fuel type is important.
Coal: A high-carbon legacy
Coal is a combustible black or brownish-black sedimentary rock, formed as rock strata called coal seams, primarily burned to generate electricity and provide heat.
Coal emissions are consistently among the highest for electricity generation.
- Lifecycle GHG Emissions: Median values are about 1001 gCO2eq/kWh.
- Key Emission Stages: Mining (including potent coal mine methane releases), processing, transportation, and combustion. The coal carbon footprint is a primary reason for its declining use in many regions, though it remains a significant part of the global energy mix emissions.
Natural gas: Cleaner than coal, but methane matters
Natural gas is a naturally occurring hydrocarbon gas mixture consisting primarily of methane, commonly used as a source of energy for heating, cooking, and electricity generation.
Often seen as a "bridge fuel," natural gas emissions from combustion are lower than those from coal.
- Lifecycle GHG Emissions (Combined Cycle): Median values around 486g CO2eq/kWh.
- The Methane Factor: Methane (CH4), the main component of natural gas, is a powerful GHG. Leakage, which can occur anywhere from extraction to distribution (the natural gas carbon footprint beyond combustion), can significantly increase its overall climate impact. If leakage rates are high, the climate benefit over coal diminishes, especially in the short term. The carbon footprint of gas production, therefore, heavily depends on controlling these fugitive gas emissions.
Petroleum-powered electricity: A niche with high impact
Petroleum-powered electricity is generated by burning refined oil products, such as diesel or heavy fuel oil, in engines or turbines to produce electricity.
While oil is primarily used for transportation, some petroleum products power electricity generation, especially in remote areas or for backup purposes.
- Lifecycle GHG Emissions: Median values are 840 gCO2eq/kWh, potentially higher for some operational figures.
- Sources: Crude oil extraction, transportation, refining (an energy-intensive process), and combustion contribute to oil emissions and the carbon footprint.
A special note: Canadian oil sands
Canadian oil sands are large deposits of bitumen, or extremely heavy crude oil, mixed with sand, clay, and water. This type of oil requires more energy-intensive extraction than conventional crude oil, resulting in a higher fossil fuel emissions profile for fuels derived from it. This impacts the generation's carbon footprint if these fuels are used for power.
{{cta}}
Carbon footprint by energy source: Low-carbon and renewable options
Many energy sources offer a much lower carbon footprint compared to fossil fuels. However, their clean energy emissions are primarily generated from manufacturing and other lifecycle stages, rather than operation.
Nuclear power: Consistent low-carbon baseload
Nuclear power is generated from the heat produced through controlled nuclear fission in a reactor, which creates steam to spin turbines and produce electricity.
Nuclear energy's carbon emissions are very low over its lifecycle.
- Lifecycle GHG Emissions: Median value is 13 gCO2eq/kWh.
- Emission Sources: Uranium mining, milling, conversion, enrichment, fuel fabrication, and plant construction/decommissioning. The nuclear carbon footprint is influenced by the energy source used for these upstream processes.
Hydropower: Generally clean, but reservoirs can emit
Hydropower, or hydroelectric power, is a renewable energy source that generates electricity by using the gravitational force of falling or flowing water to drive turbines.
Hydropower emissions are usually low, making it a key renewable source.
- Lifecycle GHG Emissions: Median values around 20 to 24 gCO2eq/kWh.
- Factors: The construction of dams and turbines is the primary source. For reservoir-based hydro, decomposition of flooded organic matter can release methane, particularly in the early years and in warmer climates. The hydrocarbon footprint (or hydropower carbon footprint) varies greatly by project type and location. Run-of-river projects generally have a lower hydropower GHG footprint.
Solar power: Manufacturing drives its footprint
Solar power involves converting sunlight into electricity, either directly using photovoltaic (PV) panels made of semiconductor cells or indirectly using concentrated solar power systems.
The solar carbon footprint is primarily associated with the manufacturing process.
- Lifecycle GHG Emissions (Utility Scale Si-based): Recent U.S. figures range from 10 to 36 gCO2eq/kWh; older global medians are around 28-43 gCO2eq/kWh.
- Key Drivers: Energy-intensive silicon purification and module manufacturing. The solar panel's carbon footprint is lower if manufacturing uses clean energy. Higher solar irradiance at the installation site also means lower solar emissions per kWh generated.
Wind power: Material-intensive, but clean operation
Wind power harnesses the kinetic energy of the wind using large turbines, whose blades capture wind, causing them to rotate, which in turn spins a generator to create electricity.
Wind emissions are also concentrated in manufacturing.
- Lifecycle GHG Emissions: Median values around 10 to 14 gCO2eq/kWh.
- Contributors: Production of blades (composites), towers (steel/concrete), and nacelles (steel, copper, sometimes rare earth elements). The transportation of large components also contributes to the wind industry's carbon footprint. Higher capacity factors from good wind resources lower the wind turbine emissions (lifecycle) per kWh.
Geothermal energy: Tapping Earth's heat with varied results
Geothermal energy is heat derived from the Earth's subsurface, which can be harnessed to generate electricity or for direct heating and cooling applications.
Geothermal emissions depend heavily on the technology used to convert Earth’s heat into electricity. The two main types are:
- Binary Cycle Plants: These operate as a closed-loop system. Geothermal hot water is pumped through a heat exchanger, where it heats a secondary fluid (like isobutane or pentane) that has a lower boiling point. This secondary fluid vaporizes and drives the turbines. Because the geothermal water itself is not exposed to the air and is reinjected underground, these plants typically have minimal to zero direct operational emissions of reservoir gases.
- Lifecycle GHG Emissions: Very low, around 38 gCO2eq/kWh. The geothermal carbon footprint for binary plants primarily stems from drilling and construction activities.
- Flash Steam Plants: These plants utilize high-pressure, hot water sourced from deep underground. As this water rises to the surface, the pressure drop causes it to convert (or 'flash') into steam rapidly. This steam is then used to drive turbines directly. If the geothermal water contains dissolved gases like CO2 or H2S, these can be released into the atmosphere with the steam.
- Lifecycle GHG Emissions: Higher, around 47 gCO2eq/kWh or more if reservoir gases (CO2, H2S) are released. For flash plants, operational releases of non-condensable gases, if present in the reservoir, can dominate their geothermal power emissions.
Biomass and bioenergy: A complex carbon equation
Biomass energy is derived from organic materials such as plants, wood, agricultural crops, and organic waste, which can be burned directly for heat or converted into electricity or biofuels.
The biomass carbon footprint is highly debated and variable.
- Lifecycle GHG Emissions: Medians range widely, from 57 to 230 gCO2eq/kWh, but can be much higher or even negative (with carbon capture).
- Critical Factors: The assumption of "carbon neutrality" for burning biomass is conditional. Land-use change (LUC), feedstock type (wastes vs. dedicated crops), and temporal dynamics of carbon release and reabsorption significantly impact biomass emissions and the overall emissions from biomass energy.
Comparing power source emissions: A clear divide
When we compare energy emissions across their full lifecycle, a pattern emerges (lowest emissions, rank = 1):
This table highlights the significant difference between traditional fossil fuel emissions and low-carbon energy sources.
One key insight is the shift from operational emissions (for fossil fuels) to embodied emissions (for many renewables and nuclear power), which are found in manufacturing and construction. This makes decarbonizing industrial supply chains important.
Key factors shifting energy carbon footprints
Several elements influence the final carbon footprint by energy source for any specific project:
- Technology & Efficiency: Newer, more efficient power plants (e.g., ultra-supercritical coal, advanced NGCC) or renewable technologies (such as more efficient solar cells and larger wind turbines) generally have lower emissions per kWh.
- Resource Quality & Location: Higher solar irradiance, stronger wind resources, better quality coal, or less methane-prone gas fields lead to lower lifecycle emissions.
- Operational Practices: Good maintenance and, for natural gas, diligent methane leak detection and repair, significantly reduce operational emissions.
- Regulatory Landscape: Emission standards and methane regulations can drive down the carbon footprint of energy sources.
- Manufacturing Grid Mix: The electricity emissions sources used to manufacture components for solar, wind, or nuclear facilities heavily impact their embodied carbon. Using clean energy emissions data for manufacturing locations is key.
Can carbon capture (CCUS) change the game?
Carbon Capture, Utilization, and Storage (CCUS) aims to capture CO2 from sources like power plants. While it can reduce direct power generation emissions (e.g., lowering GHG emissions from coal power or natural gas electricity), CCUS incurs an energy penalty (requiring more fuel per net kWh) and its own lifecycle emissions from manufacturing and operating the capture system. A comprehensive LCA is necessary to accurately assess its true benefits.
Accurate carbon accounting: The foundation for change
Understanding the true emissions by energy type requires robust carbon accounting. Challenges in LCA, such as different system boundaries or the handling of co-products, can lead to varied results.
This complexity underscores the need for transparent and consistent methods. For your business, accurately measuring your Scope 2 emissions (from purchased electricity) means understanding the grid carbon footprint or specific power source emissions you rely on.
This detailed knowledge of energy source carbon intensity and lifecycle emissions of electricity is what allows companies to:
- Identify emission hotspots in their energy consumption.
- Make informed choices about energy procurement.
- Report accurately on their carbon footprint.
- Develop credible net-zero strategies for decarbonization.
Arbor: Simplifying your path to lower energy emissions
Navigating the complexities of energy emissions and the impact of energy sources on emissions can seem complicated. Your company needs reliable carbon reporting data to comply with regulations and meet the expectations of its stakeholders.
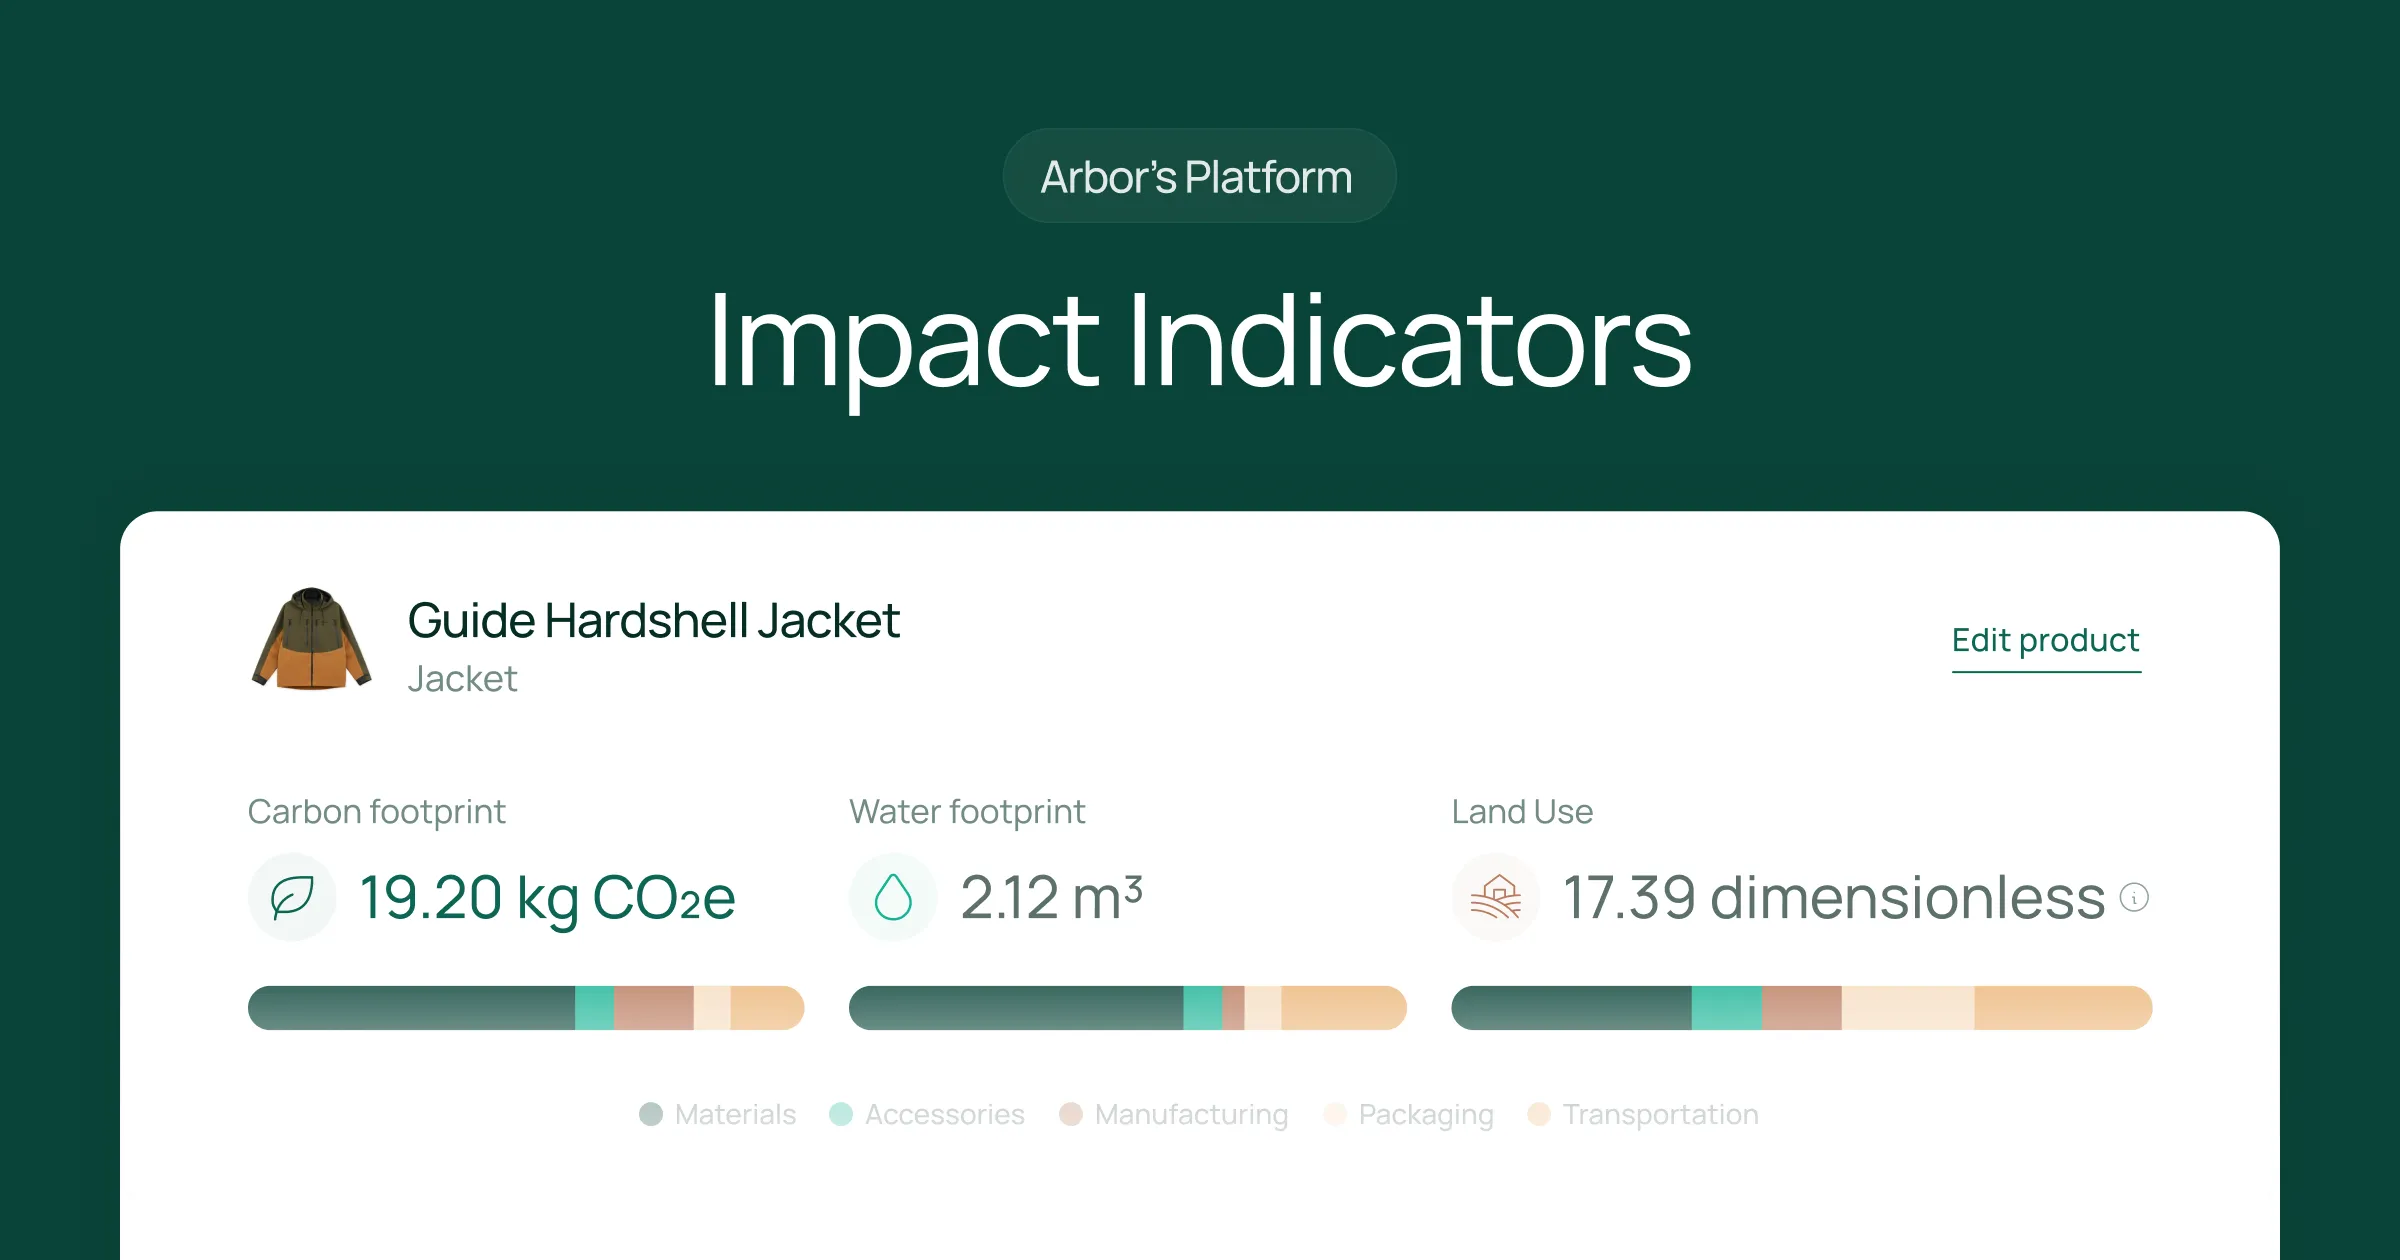
Arbor’s carbon accounting platform helps you measure, manage, and reduce your company's carbon footprint, including emissions from your energy use. We provide tools to:
- Accurately calculate Scope 1, 2, and 3 emissions.
- Understand your electricity's carbon impact based on regional grid data.
- Conduct Product Carbon Footprints (PCFs) and Life Cycle Assessments (LCAs) to understand the embodied carbon in your products, which includes the energy used in their production.
Our platform streamlines data collection and delivers actionable insights, enabling you to concentrate on achieving your sustainability objectives and minimizing your overall greenhouse gas (GHG) emissions and energy sector impact.
Summary
The path to a lower-carbon economy involves a significant shift in how we produce and consume energy. By understanding the carbon footprint of energy sources, your business can make strategic decisions that benefit both your bottom line and the environment.
Whether it's investing in energy efficiency, procuring renewable energy, or collaborating with your supply chain to reduce emissions from generation, data-driven choices are paramount.
Ready to take action on your company’s energy emissions?
Talk to an Arbor carbon expert today and start measuring your company's carbon footprint accurately.
Measure your carbon emissions with Arbor
Simple, easy carbon accounting.


.webp)
%20Directive.webp)


.webp)


%20Arbor.avif)


%20Arbor.avif)


.avif)


%20Arbor%20Canada.avif)

.avif)
%20Arbor.avif)
.avif)


_.avif)
.avif)
%20Arbor.avif)


%20Software%20and%20Tools.avif)


.avif)
.avif)


%20EU%20Regulation.avif)


.avif)


%20Arbor.avif)


_%20_%20Carbon%20101.avif)


.avif)


